Q3 NOPD District-Level Armed Robbery Trends 2019-2023
CLICK MAP TO VIEW 2023 Armed Robbery Locations

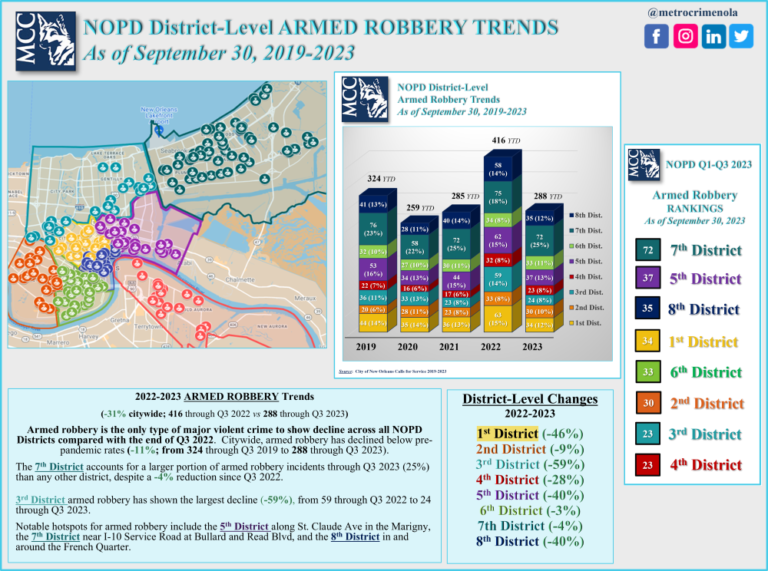
CLICK MAP TO VIEW 2023 Armed Robbery Locations
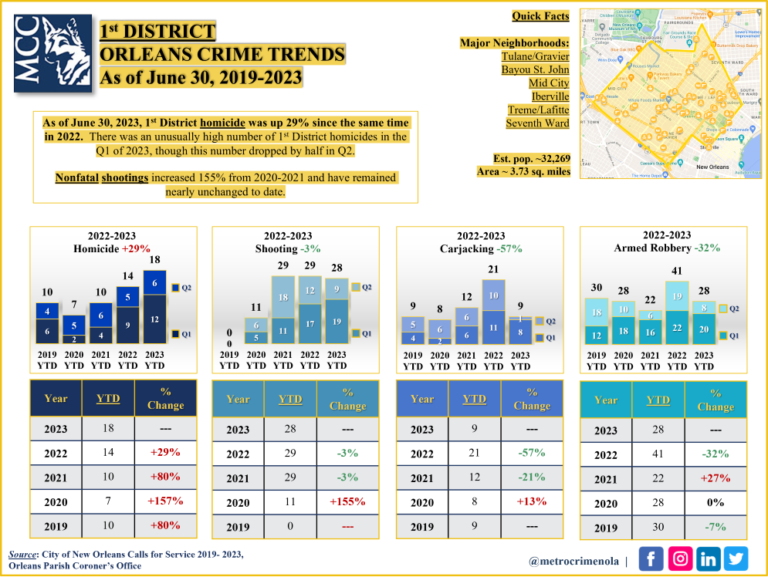
As of June 30, 2023, 1st District homicide was up 29% since the same time in 2022. There was an unusually high number of 1st District homicides in Q1 of 2023, though this number dropped by half in Q2. Citywide Trends: Homicide -14% Nonfatal Shooting -12% Carjacking -43% Armed Robbery -13% 2023 First District Trends…
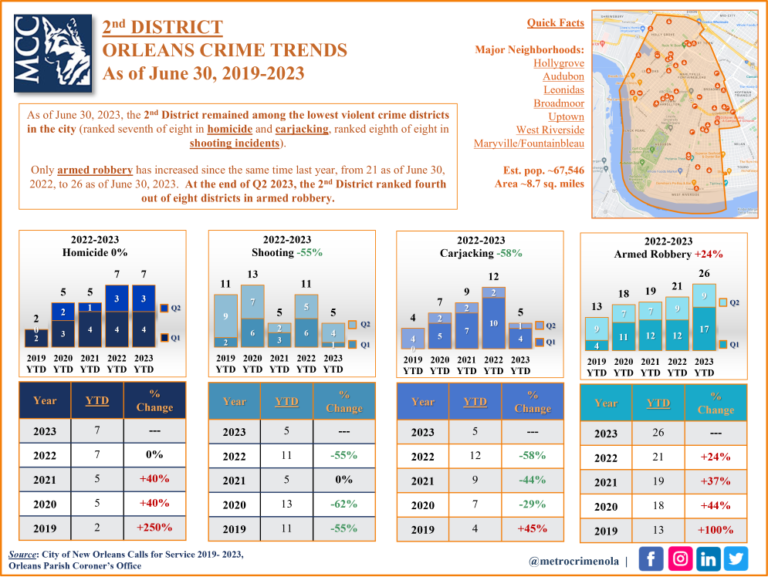
The 2nd District ranks among the lowest districts for nearly all major violent crime categories, with the notable exception of armed robbery. At the end of Q2 2023, the 2nd District ranked fourth of eight districts in armed robbery, the only major violent crime category to show increase in this district compared with the last four…
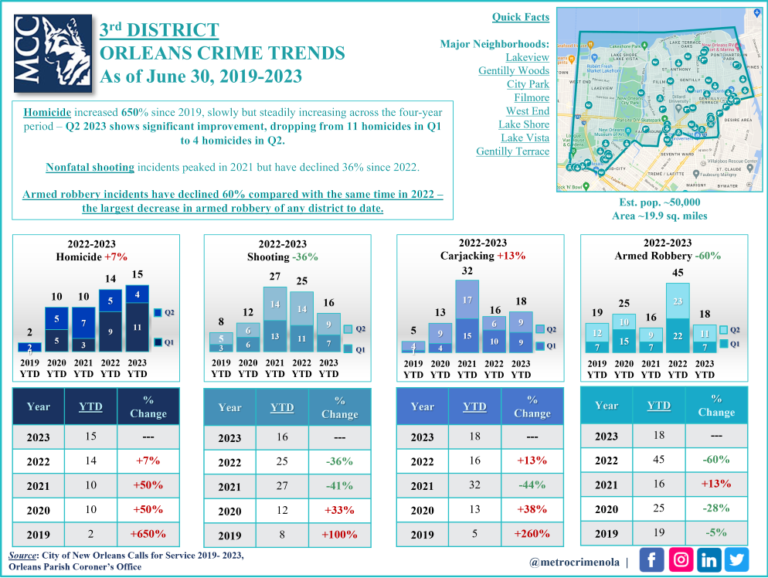
The 3rd District has the largest decline in armed robbery of any NOPD district compared with 2022, now ranked seventh of the eight districts. At this time in 2022, the 3rd District was tied with the 7th District for highest armed robbery rates in the city, each at 45 as of June 30, 2022. Thus,…
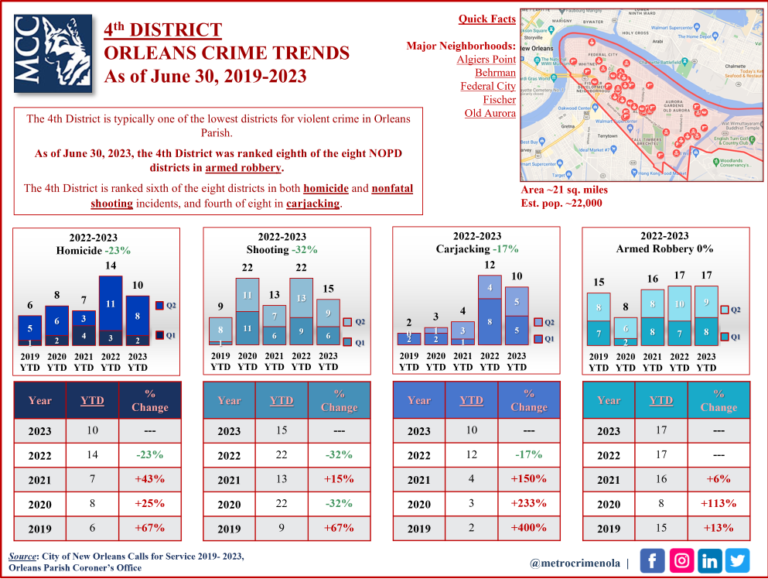
As of June 30th, 2023, the 4th District had fewer armed robbery incidents than any other district (ranked eighth of eight NOPD districts). However, carjacking incidents have remained near 2022 numbers, showing a much slower rate of decrease than the citywide 43% reduction in carjacking. Citywide Trends: Homicide -14% Nonfatal Shooting -12% Carjacking -43% Armed Robbery…
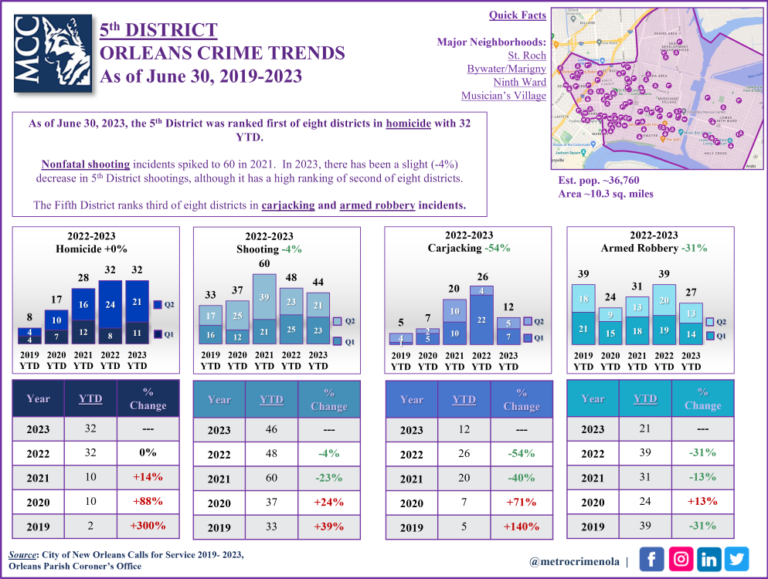
Despite its relatively small size and population, the Fifth District continues to rank among the top 3 districts in all categories of major violent crime: Homicide: Ranked first of eight districts Nonfatal Shooting: Ranked second of eight districts Carjacking and Armed Robbery: Ranked third of eight districts Citywide Trends: Homicide -14% Nonfatal Shooting -12% Carjacking -43% Armed Robbery…
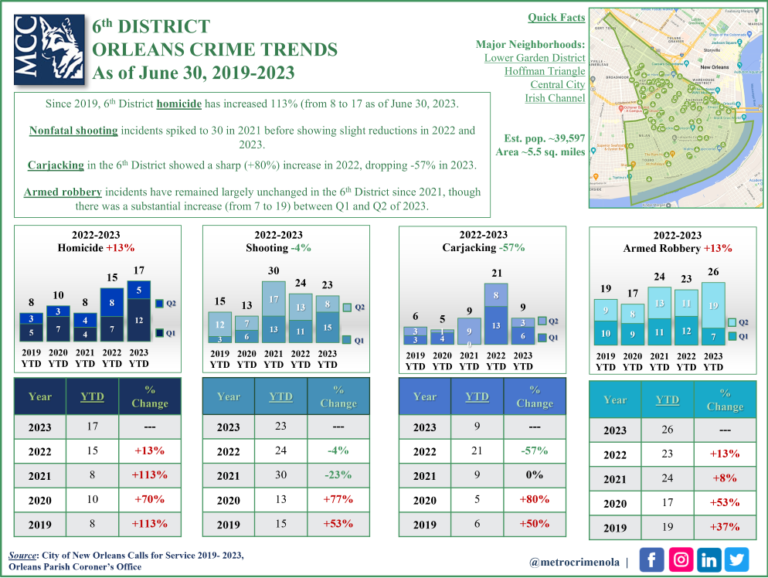
Despite its relatively small size (5.5 sq. miles), the Sixth District ranked fourth of eight NOPD Districts in homicide and nonfatal shootings as of June 30, 2023. Citywide Trends: Homicide -14% Nonfatal Shooting -12% Carjacking -43% Armed Robbery -13% 2023 Sixth District Trends HOMICIDE (+113% since 2019; +70% since 2020; +113% since 2021; +29%…
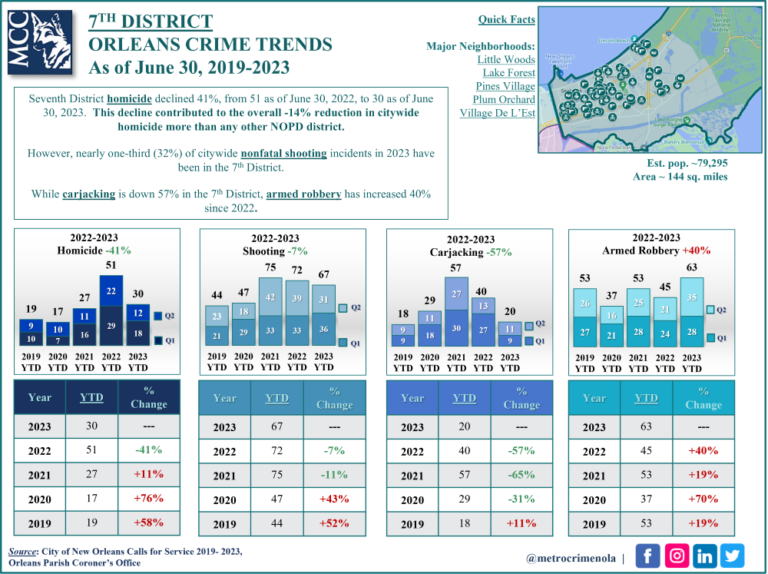
While the Seventh District continues to account for a substantial portion of Orleans Parish violent crime, the 41% decline in 7th District homicide contributed more to the citywide 14% decline than any other NOPD district. Citywide Trends: Homicide -14% Nonfatal Shooting -12% Carjacking -43% Armed Robbery -13% 2023 Seventh District Trends HOMICIDE (+58% since…
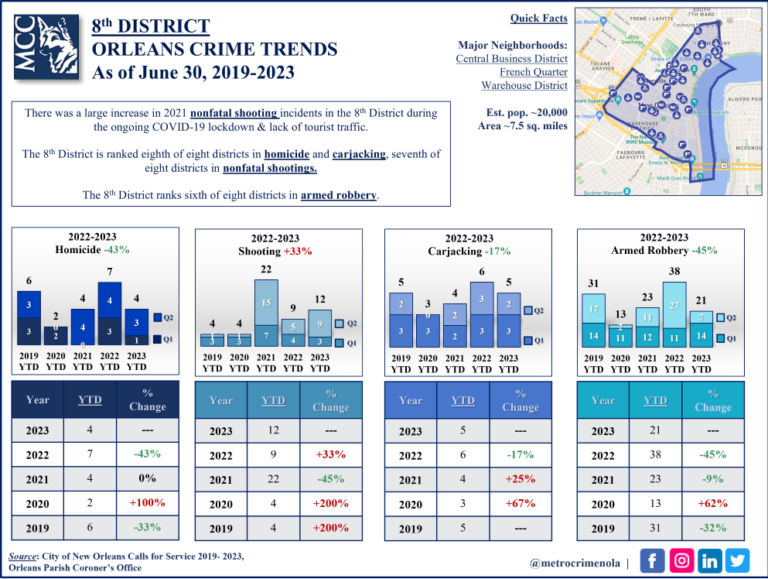
The 8th District is typically one of the lowest districts for violent crime, largely due to low residential/high tourist traffic. As of Q2 2023, the 8th District ranked eighth of eight districts on homicide and carjacking, seventh of eight districts on nonfatal shootings, and sixth of eight districts on armed robbery. Citywide Trends: Homicide -14%…
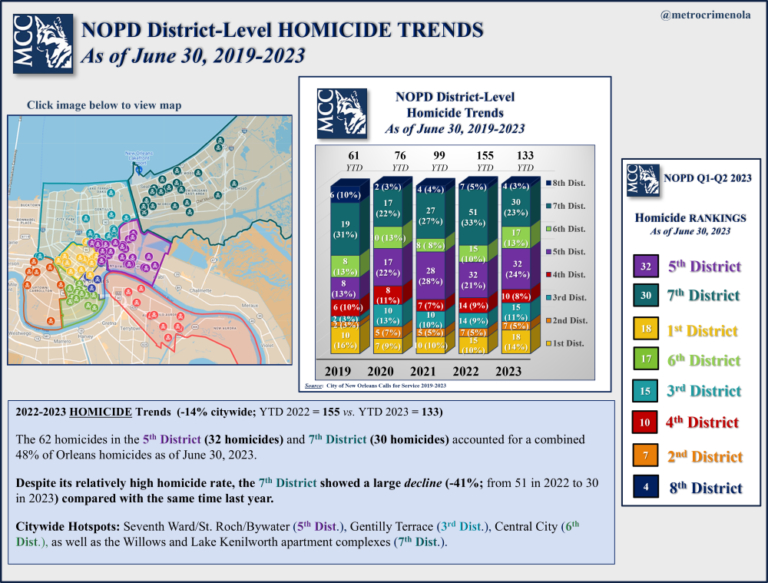
2022-2023 HOMICIDE Trends 14% DECLINE in citywide homicides vs. June 30, 2022 (YTD 2022 = 155 vs. YTD 2023 = 133) The 62 homicides in the 5th District (32 homicides) and 7th District (30 homicides) accounted for a combined 48% of Orleans homicides as of June 30, 2023. Despite its relatively high homicide rate,…